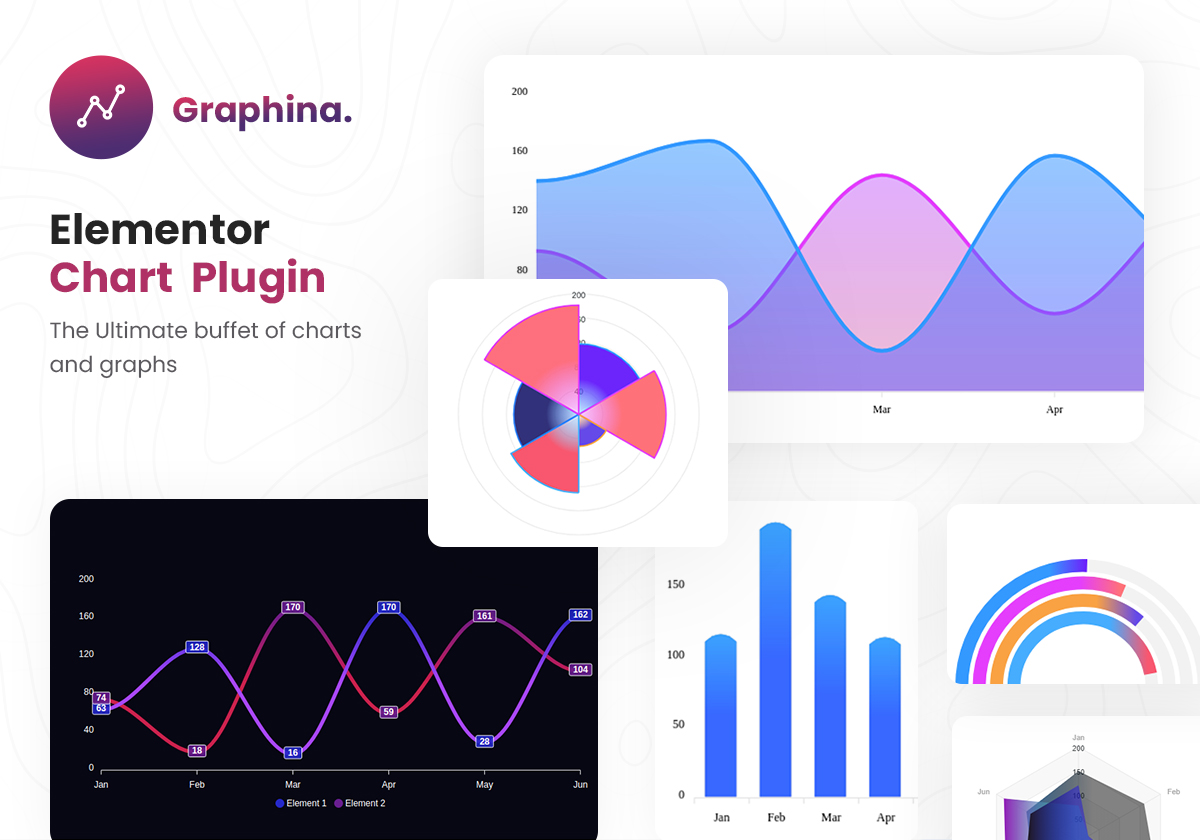
Graphina – Elementor Charts and Graphs: Breakdown

The Graphina – Elementor Charts and Graphs plugin offers a wide variety of chart types to choose from, including line, bar, pie, doughnut, and more. Each chart type comes with its own unique set of customization options, allowing you to create charts that best suit your needs.
One of the key features of this plugin is its compatibility with Elementor, a popular WordPress website builder. With Graphina, you can easily add charts and graphs to your Elementor-powered pages, allowing for seamless integration and further customization.
Not only does Graphina provide you with pre-built chart templates, but it also allows you to create your own custom templates from scratch. This gives you complete control over the design and layout of your charts, ensuring they align with your website's branding.
The plugin also offers a range of data visualization options, such as tooltips and animation effects. These features enhance the user experience and make it easier for your website visitors to understand and interpret the data being presented.
Furthermore, Graphina includes advanced data manipulation capabilities. You can import data from various sources, such as CSV and Excel files, and easily transform it into interactive charts and graphs. This eliminates the need for manual data entry and streamlines the process of creating visual representations of your data.
Graphina also provides responsive design options, ensuring that your charts and graphs look great on all devices and screen sizes. This is especially important in today's mobile-first world, where a large portion of website traffic comes from smartphones and tablets.
With its intuitive interface and drag-and-drop functionality, Graphina makes it easy for users of all skill levels to create stunning charts and graphs. Whether you're a beginner or an experienced web designer, this plugin provides a seamless experience that saves you time and effort.