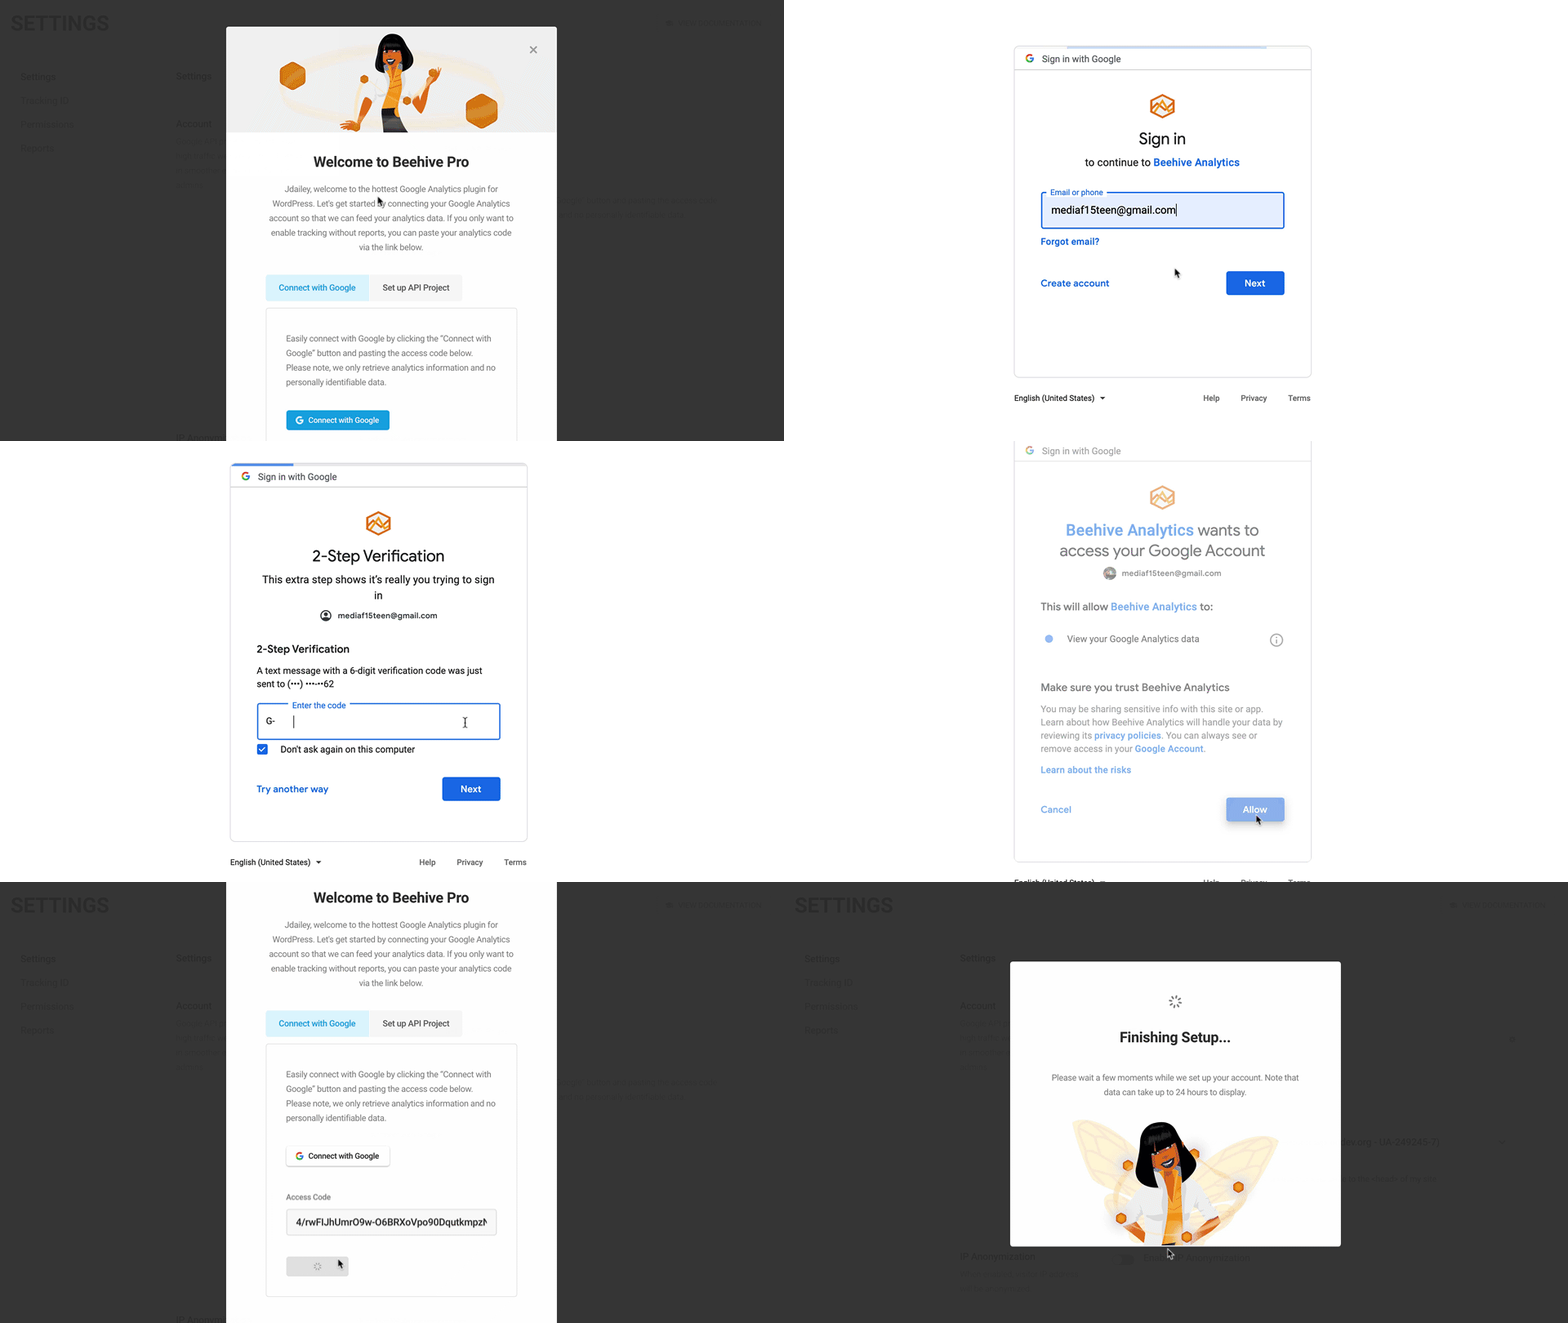
Beehive Analytics – Google Analytics Dashboard: Breakdown

Beehive Analytics allows website owners to quickly and easily analyze their website’s performance with the help of Google Analytics’ advanced features. It provides users with detailed reports and graphs of data such as total page views, the most popular pages, the average time spent on pages and visits, top referring sites, and a lot more. With this plugin, website owners can compare their website’s performance over time and analyze customer behavior.
The plugin also allows website owners to view their website’s Google AdWords campaigns and helps them detect fraudulent activity as well as missing or incorrect conversions. Moreover, Beehive Analytics includes features that allow users to track the performance of their website across different regions, languages, and devices, enabling them to tailor their website to their audience’s preferences. Additionally, the plugin enables users to track their websites time on page, bounce rates, and more.
The plugin also allows users to keep track of their website’s performance with its built-in dashboard, which displays key performance indicators such as page rank, visits, conversions, and more. It also displays a number of graphs that help users visually analyze their website’s data. Additionally, users can use Beehive Analytics’ alerting feature to set up automated email notifications whenever their website reaches a certain threshold or goals, such as when their website receives a certain number of visitors or hits a certain page view goals.