Visualizer: Tables and Charts Manager for WordPress: Breakdown

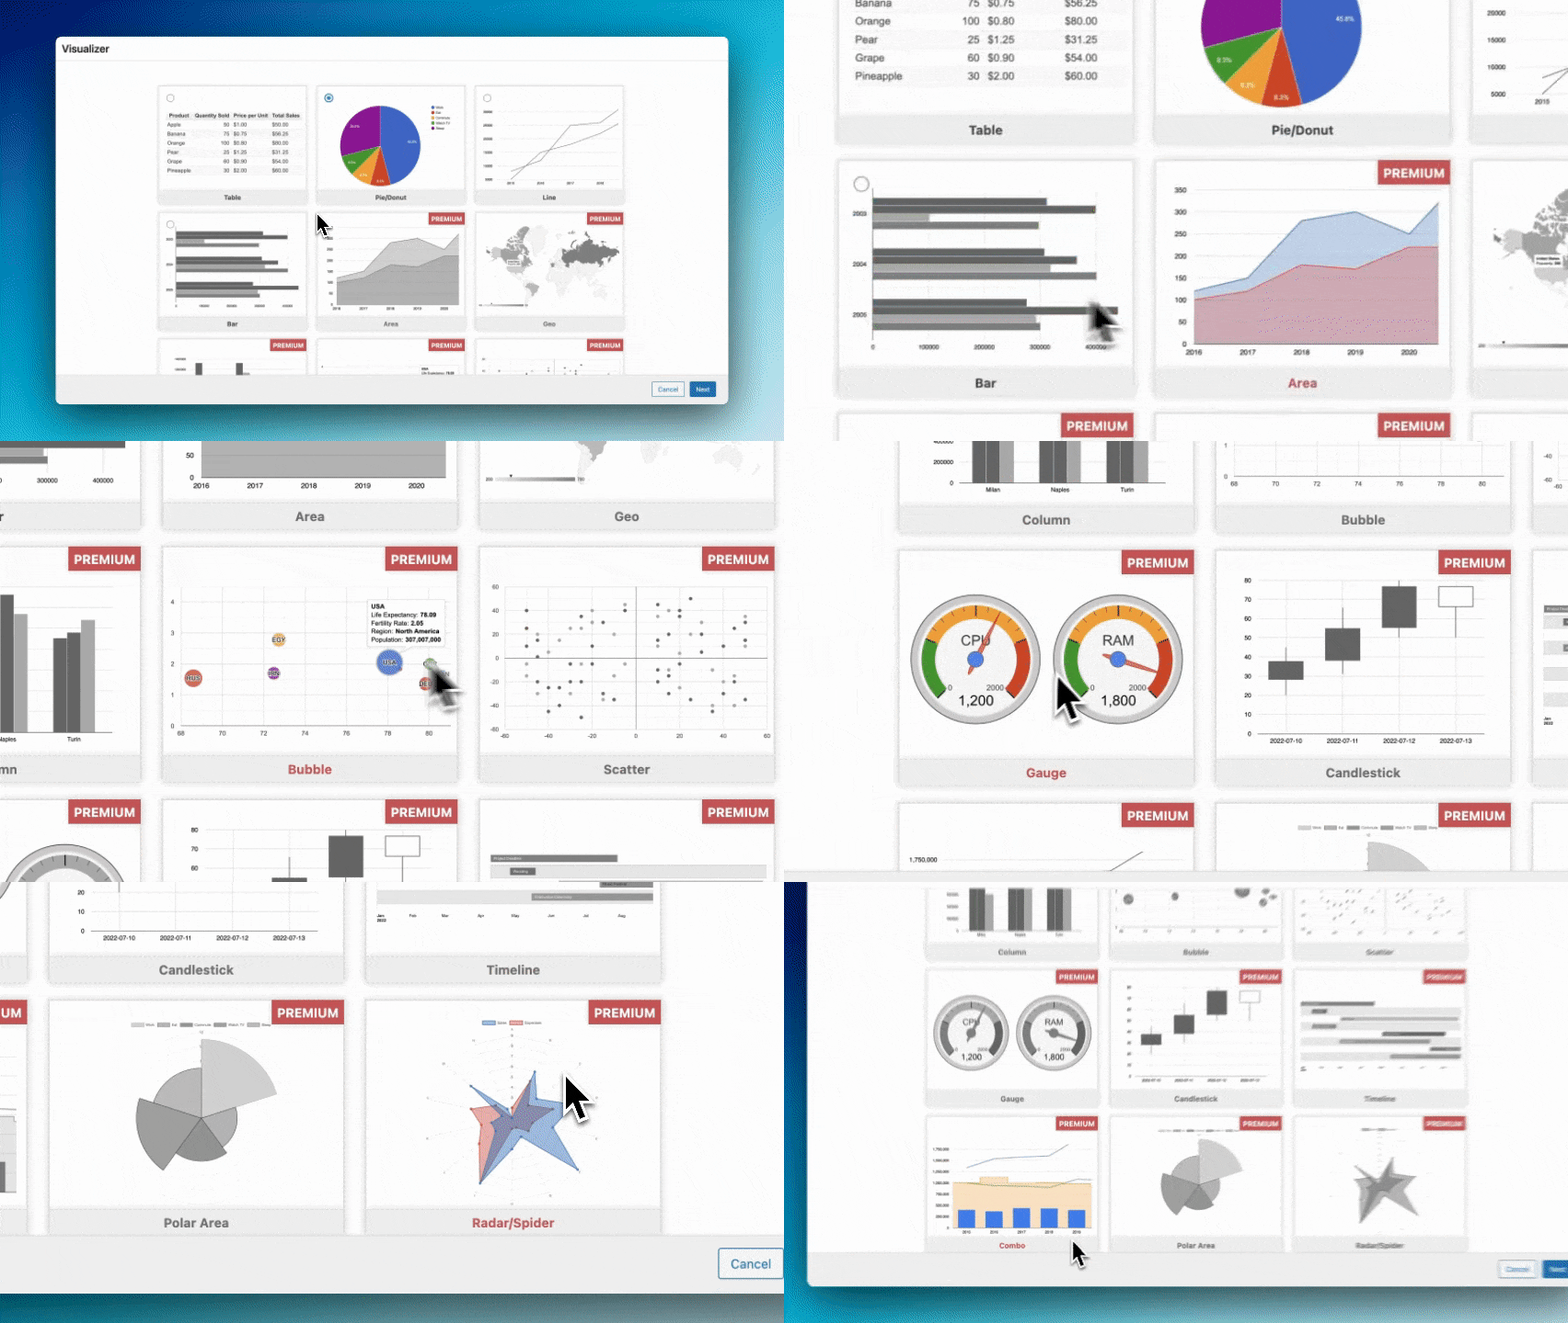
Visualizer is an aesthetic and focused plugin for adding tables and charts to WordPress sites. This makes it easy to represent data visually in an engaging way. The intuitive and user-friendly interface provides fast and easy access to the entire collection of Visualizer features. It also includes multiple data supported formats, allowing users to upload data from, for example, CSV and Excel files, and from the popular Google Sheets. In addition, Visualizer offers several chart types, including area, bar, bubble, column, line, pie and scatter charts, with more than twelve charts available to the user.
The charts can be organized in a myriad of ways, allowing the user to configure visualizations according to their individual needs. These tools are designed to be dynamic and responsive to user input, providing various customization options without any coding needed. For example, different charts may have a single or multiple series, different value scales, axis labels and legends. Hundreds of colors are available to choose from for chart elements, and charts can be aligned and positioned according to specific project requirements.
The plugin also offers a Live Editing feature, which enables users to make adjustments to the chart in real time. Elsewhere, with the static mode, Visualizer will automatically generate a suitable chart as soon as a data set has been uploaded. Finally, Visualizer also contains several sharing options, allowing users to share charts by direct link, embed code or file export.